
I’m back! I’ve finally caught up after my holiday in early September.
Games Workshop and TSports Meta Stats
Last week Games Workshop released an article and follow up video on the state of the Age of Sigmar and 40k metas. This was a refreshing approach from them as they talked about what it was used for and where the data was drawn from.
I wanted to spend a few words by explaining why I’ll be carrying on with these stats and how they differ not only to Games Workshop‘s but to the fantastic TSports Network Stat centre.
For a start we all take our data from Best Coast Pairing (BCP) and Tabletop.to (TTO) however which data we use and how we use it is different. Games Workshop scrape all the data for AoS from BCP and TTO, while HWG and ourselves only take data from two day events (known as GT’s).
Games Workshop’s data therefore includes all one day events (RTT’s), one off matches and even test tournaments where organisers are trailing BCP and TTO to check whether it would work for what they need. As such the data they include (in my opinion) is not fully indicative of the sharp end of the meta that you find at Grand Tournaments each week.

This can be shown by the win rates of each faction in and I particular Seraphon. Shown above they have a 54% win rate which places them in the ideal 45-55% range. However, our own and HWG stats have them at roughly 57% and third on the list as our data is only taken from GT’s.

But we differ also to HWG in our stats results (slightly) as we work the data in a different way.
Where Games Workshop and HWG only count wins as wins (logical) we also count draws as 0.5 win and 0.5 losses. Why? Good question!
We do this mainly to give players and factions a more reflective (in my opinion) win rate when compared to their performance.

Above is an example as to why, Rob Wales did a Stirling job and came 39th with 1 win , 3 draws and a loss. The way both GW and HWG would treat this is as a 20% win rate (1/5 = 0.2). The way we show this is by taking the win as a value of 1 and adding 0.5 for each draw giving a total of 2.5 (which is also what BCP do). This way Rob ends up with a 50% win rate instead and is a fair reflection of both his performance in the tournament and how his army faired against the other factions.
That’s how we all calculate our stats and why our results differ slightly, we’ll leave it up to you as to who you want to rely on but all have their benefits.
The Running Stats

This graph shows each faction win rate for the four weeks leading up to the date at the top. This should show the effect of new Battletomes dropping as well as changes players make in adapting to the meta.
Faction Win Rates
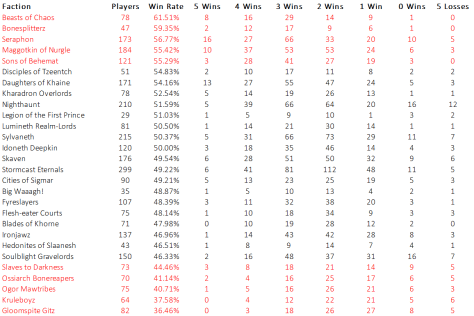
The above shows the various factions win rates since the new GHB dropped back in July. This also shows how many players have used them at events, and how those players finished at events. Note there is a category for 0 wins and 5 losses. This is because there are players who may not be able to the attend the second day of an event.
Player Results by Wins

This graph has at least two purposes. Firstly it shows the faction popularity by the number of players and secondly it breaks down those players results in terms of the number of wins they achieve.
Factions with 5-0 Results

This graph simply shows the number of 5-0 the factions have achieved.
Win Chance

This shows the chance each faction has of achieving 5-0. This is calculated using the number of players that go 5-0 against the full number of players using that faction.

Like above, this show the chance of getting 4 or more wins (including 5-0).

And finally the chance of going 3+ wins (including 5-0 and 4+).
Next week, I’ll be including a new graphic – Tournaments in Winning Positions (TiWP). This will break down the number of players/factions that get to round 4 in a GT with four wins. This will then be shown with a conversion into 5-0.

